))
))
))
))
))
))
))
))
))
))
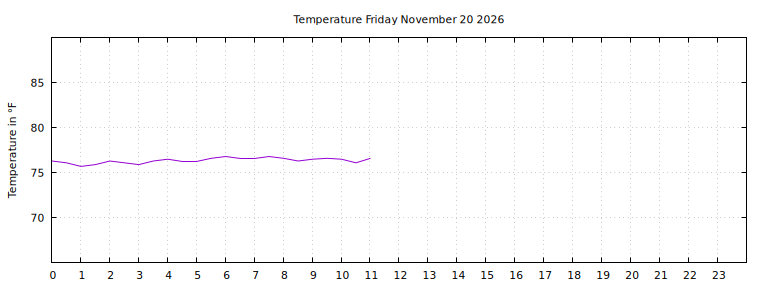
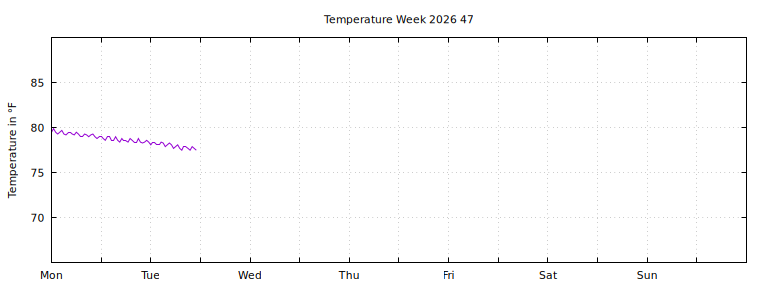
| Daily Statistics | |||||
| Day [+] | Tmin °F | Tmax °F | Mean °F | σ | n |
| Friday November 20th | 75.7 | 76.8 | 76.4 | 28% | 24 |
| Thursday November 19th | 75.9 | 78.1 | 77.1 | 55% | 48 |
| Wednesday November 18th | 77.2 | 79.2 | 78.2 | 53% | 48 |
| Tuesday November 17th | 76.8 | 78.4 | 77.7 | 38% | 48 |
| Monday November 16th | 78.3 | 79.9 | 79.0 | 40% | 48 |
| Weekly Statistics | |||||
| Week [-] | Tmin °F | Tmax °F | Mean °F | σ | n |
| Week 47 (November 16th) | 75.7 | 79.9 | 77.8 | 94% | 216 |
| Week 46 (November 9th) | 78.6 | 84.7 | 81.5 | 130% | 336 |
| Week 45 (November 2nd) | 77.4 | 83.3 | 79.8 | 169% | 336 |
| Week 44 (October 27th) | 79.5 | 84.7 | 82.3 | 130% | 283 |
| Week 43 (October 19th) | 82.9 | 85.8 | 84.2 | 59% | 144 |
| Updated every 30:th minute. |
|
|
| Monthly Statistics | |||||
| Month [+] | Tmin °F | Tmax °F | Mean °F | σ | n |
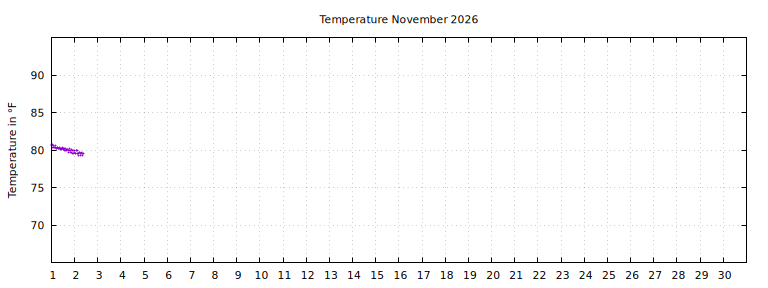
| November 2026 | 75.7 | 84.7 | 80.0 | 194% | 936 |
| October 2026 | 80.8 | 86.7 | 84.2 | 136% | 1243 |
| September 2026 | 84.0 | 88.3 | 85.8 | 88% | 1440 |
 |
| Yearly Statistics | |||||
| Year [+] | Tmin °F | Tmax °F | Mean °F | σ | n |
| 2026 | 68.5 | 93.7 | 84.6 | 438% | 15228 |
| 2025 | 61.0 | 102.9 | 81.1 | 1328% | 14148 |
| 2024 | 60.1 | 86.7 | 72.4 | 668% | 17530 |
Currently 165835 temperuture meausurements in the database.
|
| (c) Daniel Vindevåg 2004-2021 |
))
))
))
))
))
))